
In an earlier article, we demonstrated the installation and setup of Prometheus, a lightweight, and user-friendly open source monitoring tool. In this article, we will show you how to integrate data collected by Prometheus with Grafana to create beautiful dashboards. Grafana is an open source, feature rich metrics dashboard and graph editor for Graphite, Elasticsearch, OpenTSDB, Prometheus, and InfluxDB.
Before proceeding with the installation let us go over some of its features:
Features of Grafana
- Grafana provides a wide variety of visualization options to help you understand your data. These data visualization offerings include heatmaps, histograms, graphs, geomaps etc.
- You can use grafana to define alert thresholds visually and get notified via Slack, PagerDuty or other tools in case a threshold breaches.
- It allows you to import data from multiple sources and visualize the data centrally through grafana.
- Grafana has numerous plugins available thereby giving users immense scope for customization.
- Dashboards created using grafana can be shared among teams promoting more collaboration.
- Grafana can seamlessly integrate with an organization’s existing authentication mechanism.
- Grafana supports multi-tenancy. Setup multiple organizations that each can have their own admins define their own data sources, dashboards and users.
- Grafana includes power user preferences including the option to select from dark or white themes, set your home dashboard, change timezones and more.
With a basic understanding of what grafana is and it’s important features, we’ll now proceed with setting up grafana on a Centos 7 system where we had already setup Prometheus earlier.
Step 1: Download grafana and extract the downloaded file.
[root@linuxnix grafana]# curl -L -O https://grafanarel.s3.amazonaws.com/builds/grafana-2.5.0.linux-x64.tar.gz
% Total % Received % Xferd Average Speed Time Time Time Current
Dload Upload Total Spent Left Speed
100 21.9M 100 21.9M 0 0 134k 0 0:02:47 0:02:47 --:--:-- 281k
[root@linuxnix grafana]#

[root@linuxnix grafana]# ls
grafana-2.5.0.linux-x64.tar.gz
[root@linuxnix grafana]# tar zxvf grafana-2.5.0.linux-x64.tar.gz
grafana-2.5.0/bin/
grafana-2.5.0/conf/
grafana-2.5.0/public/
grafana-2.5.0/public/app/
---------------output truncated for brevity
Step 2: Start grafana.
To start up grafana go to the bin directory under the grafana-2.5.0 folder.
Here you will find the grafana-server binary.
[root@linuxnix grafana]# cd grafana-2.5.0/bin/
[root@linuxnix bin]# ls
grafana-server grafana-server.md5
[root@linuxnix bin]#
Execute this binary as shown below:
[root@linuxnix bin]# nohup ./grafana-server web > grafana.log 2>&1 &
[1] 5342
[root@linuxnix bin]#
You may check the grafana.log log file to view grafana startup log to make sure that it started correctly.
Grafana listens on port 3000 so ensure that is port is open and not in use by another service.
[root@linuxnix bin]# netstat -tulpn | grep grafana
tcp6 0 0 :::3000 :::* LISTEN 5342/./grafana-serv
Step 3: Login to the grafana web user interface.
To access the grafana web user interface point your browser to the URL http://<server IP>:3000.
You should be greeted with the below login page.
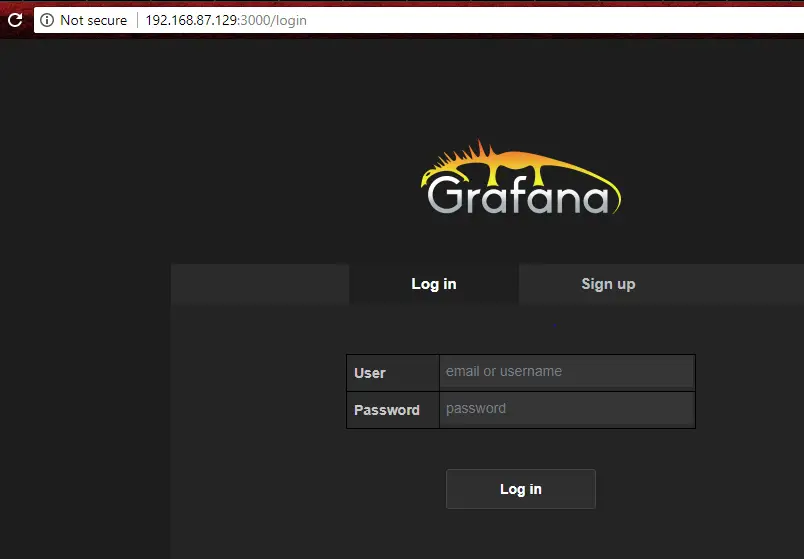
The default credentials to log in are username: admin and password: admin.
Type in these credentials and you should see the below screen.
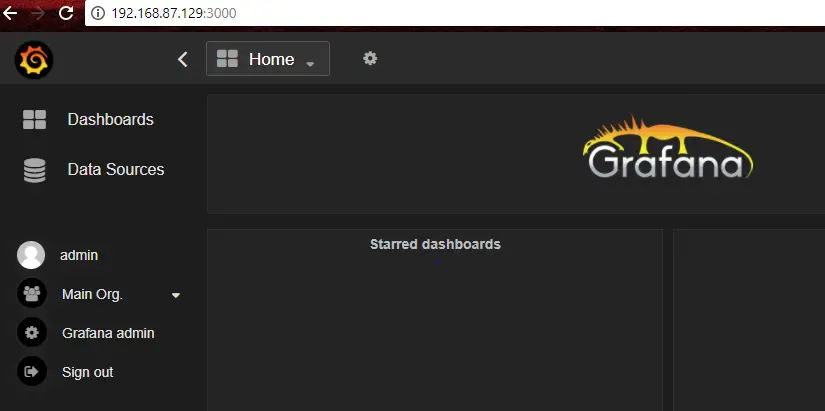
It’s empty because we have not added any data sources to grafana yet.
Step 4: Create a Prometheus data source.
Click on the Grafana logo to open the sidebar menu.
Click on “Data Sources” in the sidebar.
Click on “Add New”.
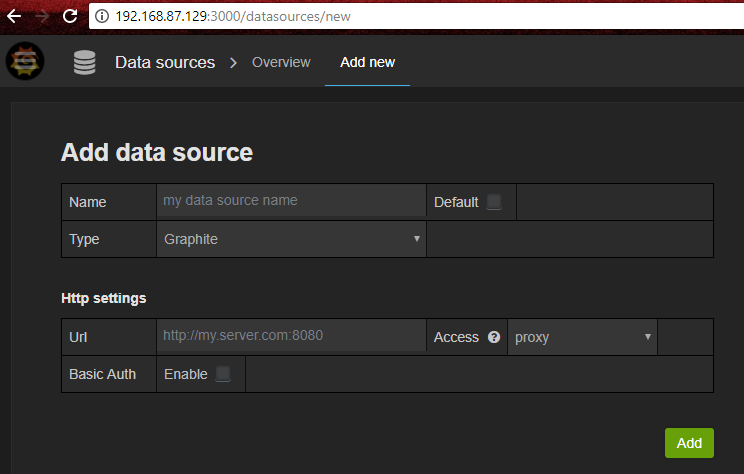
Select “Prometheus” as the type.
Set the appropriate Prometheus server URL (for example, http://localhost:9090/)
Adjust other data source settings as desired
Click “Add” to save the new data source.
Given below is a screenshot of a sample configuration:

Once you click add you’ll see the below screen. Click on test connection to make sure that grafana is able to communicate with Prometheus.
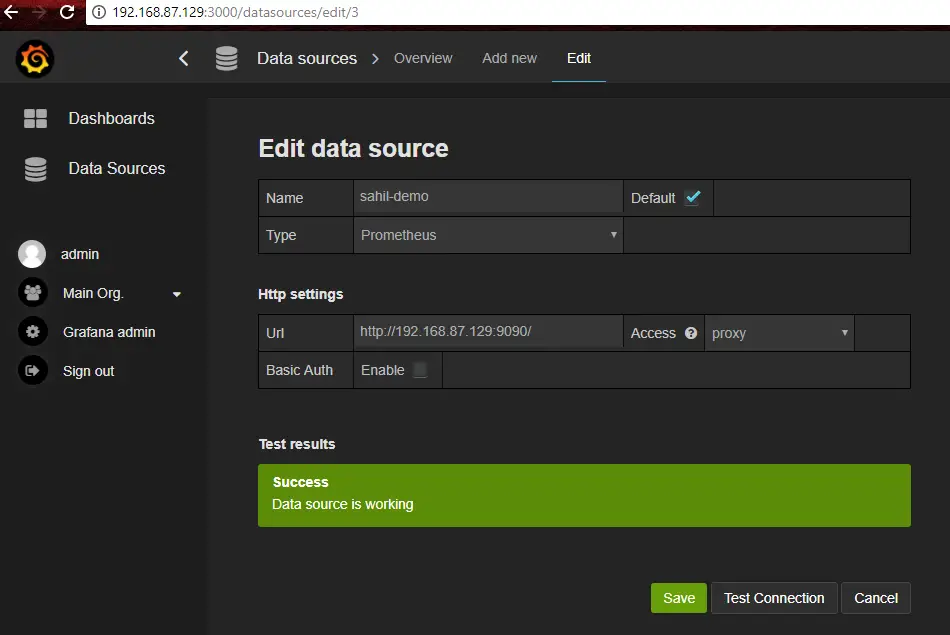
Now click save to add this Sahil-demo as a valid data source.
Step 4: Create a dashboard from the added data source.
Click “Dashboards” on the left menu.
Click “Home” on the top menu, and then “+ New” at the bottom of the panel that appears.
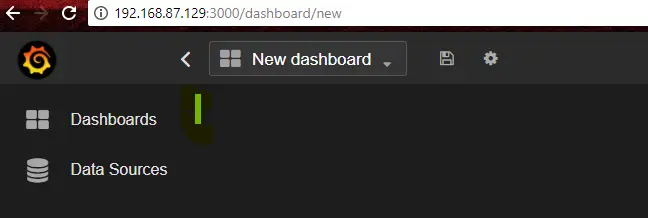
Now click on the bright green pipe symbol to expand it as a menu.
From here click on add panel followed by the graph as shown in the below screenshot.

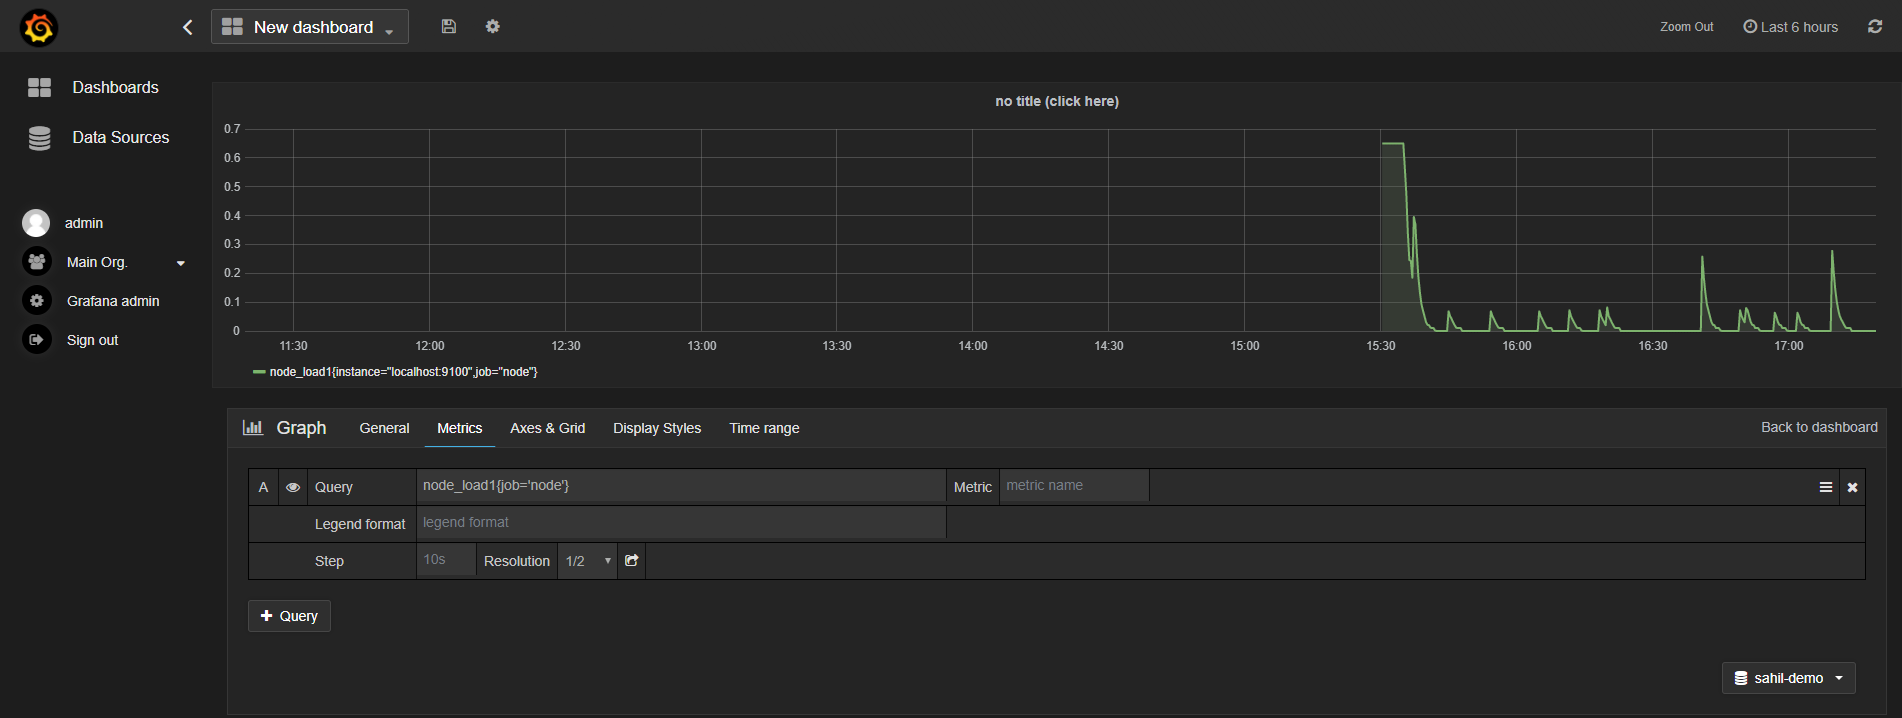
Now you should see an empty graph on your screen. Click on “no title (click here)” and then “Edit”.
Enter node_load1{job=’node’} in the “Query” field. Here job will be the job you specified in in the prometheus.yml file preceded by one of the metrics.
The metric node_load1 will denote the Prometheus metric for CPU load. You may read more on Prometheus query strings from the documentation.
Here’s another example where we obtain a graph of server CPU utilization by typing node_cpu{job=’node’} in the query field.

Click the floppy disk icon on the top menu to save your dashboard
This concludes our basic demonstration of how we could generate a graphical visualization of data in grafana using data collected by Prometheus.
Sahil Suri
Latest posts by Sahil Suri (see all)
- Google Cloud basics: Activate Cloud Shell - May 19, 2021
- Create persistent swap partition on Azure Linux VM - May 18, 2021
- DNF, YUM and RPM package manager comparison - May 17, 2021
- Introduction to the aptitude package manager for Ubuntu - March 26, 2021
- zypper package management tool examples for managing packages on SUSE Linux - March 26, 2021