

What is Prometheus?
Prometheus is an open source monitoring tool which was developed in 2012. Its architecture is modular and comes with several readily available modules called exporters, which help you capture metrics from popular software. Prometheus is written in the Go language and stores its captured data in a time series database (A time series database is optimized for handling data points indexed by time). Prometheus offers a versatile and customizable interface allowing system administrators to heavily tune the metrics they want to measure and also enhance the accuracy of measurement.
Prometheus’s main features are:
- a multi-dimensional data model with time series data identified by metric name and key/value pairs
- a flexible query language to leverage this dimensionality
- no reliance on distributed storage; single server nodes are autonomous
- time series collection happens via a pull model over HTTP
- pushing time series is supported via an intermediary gateway
- targets are discovered via service discovery or static configuration
- multiple modes of graphing and dashboard creation support
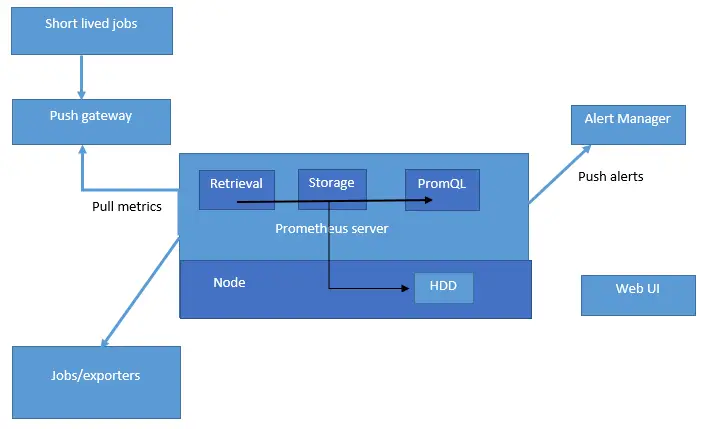
Basic architecture Prometheus
The below diagram illustrates the basic architecture of the Prometheus ecosystem and where different components fit together. Note that each Prometheus server is standalone, not depending on network storage or other remote services.
With a basic understanding of Prometheus architecture, we now proceed to install and set it up on a Centos 7 system.
Step 1: Download Prometheus software from GitHub.
We’ll use wget to download Prometheus from GitHub directly onto the server.
[root@linuxnix prometheus]# wget "https://github.com/prometheus/prometheus/releases/download/0.15.1/prometheus-0.15.1.linux-amd64.tar.gz"
--2017-11-03 09:48:30--  https://github.com/prometheus/prometheus/releases/download/0.15.1/prometheus-0.15.1.linux-amd64.tar.gz
Resolving github.com (github.com)... 192.30.253.113, 192.30.253.112
Connecting to github.com (github.com)|192.30.253.113|:443... connected.
HTTP request sent, awaiting response... 302 Found
Location: https://github-production-release-asset-2e65be.s3.amazonaws.com/6838921/e49fcd78-3488-11e5-8106-8935f61220fd?X-Amz-Algorithm=AWS4-HMAC-SHA256&X-Amz-Credential=AKIAIWNJYAX4CSVEH53A%2F20171103%2Fus-east-1%2Fs3%2Faws4_request&X-Amz-Date=20171103T134831Z&X-Amz-Expires=300&X-Amz-Signature=5d53ba71db52365395087abb1fa273ca6954b1dec3347623e9f74a63f5ca0728&X-Amz-SignedHeaders=host&actor_id=0&response-content-disposition=attachment%3B%20filename%3Dprometheus-0.15.1.linux-amd64.tar.gz&response-content-type=application%2Foctet-stream [following]
--2017-11-03 09:48:31--  https://github-production-release-asset-2e65be.s3.amazonaws.com/6838921/e49fcd78-3488-11e5-8106-8935f61220fd?X-Amz-Algorithm=AWS4-HMAC-SHA256&X-Amz-Credential=AKIAIWNJYAX4CSVEH53A%2F20171103%2Fus-east-1%2Fs3%2Faws4_request&X-Amz-Date=20171103T134831Z&X-Amz-Expires=300&X-Amz-Signature=5d53ba71db52365395087abb1fa273ca6954b1dec3347623e9f74a63f5ca0728&X-Amz-SignedHeaders=host&actor_id=0&response-content-disposition=attachment%3B%20filename%3Dprometheus-0.15.1.linux-amd64.tar.gz&response-content-type=application%2Foctet-stream
Resolving github-production-release-asset-2e65be.s3.amazonaws.com (github-production-release-asset-2e65be.s3.amazonaws.com)... 52.216.86.43
Connecting to github-production-release-asset-2e65be.s3.amazonaws.com (github-production-release-asset-2e65be.s3.amazonaws.com)|52.216.86.43|:443... connected.
HTTP request sent, awaiting response... 200 OK
Length: 7518280 (7.2M) [application/octet-stream]
Saving to: ‘prometheus-0.15.1.linux-amd64.tar.gz’
100%[==================================================================================================================================================================>] 7,518,280    161KB/s   in 55s
2017-11-03 09:49:29 (134 KB/s) - ‘prometheus-0.15.1.linux-amd64.tar.gz’ saved [7518280/7518280]
[root@linuxnix prometheus]#
Now uncompress and extract the downloaded file.
[root@linuxnix prometheus]# tar -zxvf prometheus-0.15.1.linux-amd64.tar.gz
prometheus
promtool
consoles/
consoles/cassandra.html
consoles/haproxy-backends.html
consoles/aws_elb.html
consoles/aws_elasticache.html
consoles/aws_redshift-cluster.html
consoles/haproxy.html
consoles/federation_template_example.txt
consoles/node.html
consoles/node-overview.html
consoles/haproxy-frontends.html
consoles/aws_redshift.html
consoles/haproxy-frontend.html
consoles/node-disk.html
consoles/node-cpu.html
consoles/haproxy-backend.html
consoles/cloudwatch.html
consoles/index.html.example
console_libraries/
console_libraries/menu.lib
console_libraries/prom.lib
This completes the installation. On typing the ls command you will observe a file named Prometheus extracted in the current working directory. This is the actual Prometheus binary. You may verify your installation of Prometheus by tying “./prometheus –version”
[root@linuxnix prometheus]# ls

console_libraries  consoles  prometheus  prometheus-0.15.1.linux-amd64.tar.gz  promtool
[root@linuxnix prometheus]# ./prometheus -version
prometheus, version 0.15.1 (branch: master, revision: 64349aa)
build user:       julius@julius-thinkpad
build date:       20150727-17:56:51
go version:       1.4.2
Step 2: Download the Prometheus node exporter.
As we mentioned earlier Prometheus has a modular architecture and has several modules available for use called exporters. Now we will install one such exporter referred to as the node exporter. The node exporter is an application that runs on a node and collects information at various metrics like memory, I/O and more. It also exposes an endpoint, which the Prometheus server scrapes at regular intervals and collects the metrics.
We’ll now download the node exporter from GitHub.
[root@linuxnix prometheus]# mkdir -p node_exporter
[root@linuxnix prometheus]# cd node_exporter
[root@linuxnix node_exporter]# pwd
/root/prometheus/node_exporter
[root@linuxnix node_exporter]# wget https://github.com/prometheus/node_exporter/releases/download/0.11.0/node_exporter-0.11.0.linux-amd64.tar.gz -O ~/Downloads/node_exporter-0.11.0.linux-amd64.tar.gz
--2017-11-03 10:06:02--  https://github.com/prometheus/node_exporter/releases/download/0.11.0/node_exporter-0.11.0.linux-amd64.tar.gz
Resolving github.com (github.com)... 192.30.253.113, 192.30.253.112
Connecting to github.com (github.com)|192.30.253.113|:443... connected.
HTTP request sent, awaiting response... 302 Found
Location: https://github-production-release-asset-2e65be.s3.amazonaws.com/9524057/ee77f366-34ba-11e5-944f-7e3f27ce85ce?X-Amz-Algorithm=AWS4-HMAC-SHA256&X-Amz-Credential=AKIAIWNJYAX4CSVEH53A%2F20171103%2Fus-east-1%2Fs3%2Faws4_request&X-Amz-Date=20171103T140609Z&X-Amz-Expires=300&X-Amz-Signature=01596fe7b6630ed6b6799614908fcf9eb0435d102d3945b9b5d0caa9ef73c986&X-Amz-SignedHeaders=host&actor_id=0&response-content-disposition=attachment%3B%20filename%3Dnode_exporter-0.11.0.linux-amd64.tar.gz&response-content-type=application%2Foctet-stream [following]
--2017-11-03 10:06:09--  https://github-production-release-asset-2e65be.s3.amazonaws.com/9524057/ee77f366-34ba-11e5-944f-7e3f27ce85ce?X-Amz-Algorithm=AWS4-HMAC-SHA256&X-Amz-Credential=AKIAIWNJYAX4CSVEH53A%2F20171103%2Fus-east-1%2Fs3%2Faws4_request&X-Amz-Date=20171103T140609Z&X-Amz-Expires=300&X-Amz-Signature=01596fe7b6630ed6b6799614908fcf9eb0435d102d3945b9b5d0caa9ef73c986&X-Amz-SignedHeaders=host&actor_id=0&response-content-disposition=attachment%3B%20filename%3Dnode_exporter-0.11.0.linux-amd64.tar.gz&response-content-type=application%2Foctet-stream
Resolving github-production-release-asset-2e65be.s3.amazonaws.com (github-production-release-asset-2e65be.s3.amazonaws.com)... 54.231.72.243
Connecting to github-production-release-asset-2e65be.s3.amazonaws.com (github-production-release-asset-2e65be.s3.amazonaws.com)|54.231.72.243|:443... connected.
HTTP request sent, awaiting response... 200 OK
Length: 2846737 (2.7M) [application/octet-stream]
Saving to: ‘/root/Downloads/node_exporter-0.11.0.linux-amd64.tar.gz’
100%[==================================================================================================================================================================>] 2,846,737    145KB/s   in 20s
2017-11-03 10:06:35 (136 KB/s) - ‘/root/Downloads/node_exporter-0.11.0.linux-amd64.tar.gz’ saved [2846737/2846737]
[root@linuxnix node_exporter]# ls
[root@linuxnix node_exporter]# mv /root/Downloads/node_exporter-0.11.0.linux-amd64.tar.gz .
[root@linuxnix node_exporter]# pwd
/root/prometheus/node_exporter
[root@linuxnix node_exporter]# ls
node_exporter-0.11.0.linux-amd64.tar.gz
[root@linuxnix node_exporter]#
Let’s extract the file.
[root@linuxnix node_exporter]# tar -zxvf node_exporter-0.11.0.linux-amd64.tar.gz
node_exporter
[root@linuxnix node_exporter]#
Step 3: Configure node exporter as a service.
To configure node exporter as a service we’ll first create a system service file for this service.
[root@linuxnix~]# cat /etc/systemd/system/node_exporter.service
[Unit]
Description=Node Exporter
Wants=network-online.target
After=network-online.target
[Service]
User=root
Group=root
Type=simple
ExecStart=/root/prometheus/node_exporter/node_exporter
[Install]
WantedBy=multi-user.target
I won’t get into the detailed aspects of the service file but I’d like to mention a few points here:
The execStart variable needs to have the path of the executable which is actually the service.
The User and Group variables contain the value of the user owner and the group owner of the binary you’ve mentioned in the ExecStart variable.
If there is a discrepancy between the ownership or the binary file then the service file won’t work.
We’ll now reload system to make it aware that we’ve just added a service file.
[root@still ~]# systemctl daemon-reload
Now we’ll start the node exporter service and check it’s status.
[root@linuxnix~]# systemctl start node_exporter
[root@linuxnix~]# systemctl status node_exporter
node_exporter.service - Node Exporter
   Loaded: loaded (/etc/systemd/system/node_exporter.service; disabled)
   Active: active (running) since Fri 2017-11-03 11:25:24 EDT; 3s ago
 Main PID: 3078 (node_exporter)
   CGroup: /system.slice/node_exporter.service
           └─3078 /root/prometheus/node_exporter/node_exporter

Nov 03 11:25:24 still node_exporter[3078]: time="2017-11-03T11:25:24-04:00" level=info msg=" - stat" file="node_exporter.go" line=144
Nov 03 11:25:24 still node_exporter[3078]: time="2017-11-03T11:25:24-04:00" level=info msg=" - time" file="node_exporter.go" line=144
Nov 03 11:25:24 still node_exporter[3078]: time="2017-11-03T11:25:24-04:00" level=info msg=" - netstat" file="node_exporter.go" line=144
Nov 03 11:25:24 still node_exporter[3078]: time="2017-11-03T11:25:24-04:00" level=info msg=" - loadavg" file="node_exporter.go" line=144
Nov 03 11:25:24 still node_exporter[3078]: time="2017-11-03T11:25:24-04:00" level=info msg=" - filesystem" file="node_exporter.go" line=144
Nov 03 11:25:24 still node_exporter[3078]: time="2017-11-03T11:25:24-04:00" level=info msg=" - meminfo" file="node_exporter.go" line=144
Nov 03 11:25:24 still node_exporter[3078]: time="2017-11-03T11:25:24-04:00" level=info msg=" - textfile" file="node_exporter.go" line=144
Nov 03 11:25:24 still node_exporter[3078]: time="2017-11-03T11:25:24-04:00" level=info msg=" - netdev" file="node_exporter.go" line=144
Nov 03 11:25:24 still node_exporter[3078]: time="2017-11-03T11:25:24-04:00" level=info msg=" - diskstats" file="node_exporter.go" line=144
Nov 03 11:25:24 still node_exporter[3078]: time="2017-11-03T11:25:24-04:00" level=info msg="Starting node_exporter v0.11.0 at :9100" file="node_exporter.go" line=176
[root@still ~]#
The name of the service is same as the name of the service file minus the .service extension.
With that our service for node exporter has been configured and correctly started.
If you don’t want to configure the service file you can start the node exporter directly as shown below:
[root@linuxnix ~]# /root/prometheus/node_exporter/node_exporter
INFO[0000] No directory specified, see --textfile.directory  file=textfile.go line=40
INFO[0000] Enabled collectors:                           file=node_exporter.go line=142
INFO[0000]  - loadavg                                    file=node_exporter.go line=144
INFO[0000]  - meminfo                                    file=node_exporter.go line=144
INFO[0000]  - time                                       file=node_exporter.go line=144
INFO[0000]  - diskstats                                  file=node_exporter.go line=144
INFO[0000]  - stat                                       file=node_exporter.go line=144
INFO[0000]  - textfile                                   file=node_exporter.go line=144
INFO[0000]  - netdev                                     file=node_exporter.go line=144
INFO[0000]  - netstat                                    file=node_exporter.go line=144
INFO[0000]  - filesystem                                 file=node_exporter.go line=144
INFO[0000] Starting node_exporter v0.11.0 at :9100       file=node_exporter.go line=176
Be sure to execute the binary with & at the end to background it because when the binary executes you don’t actually get the prompt back.
Once the node exporter starts it uses port number 9100 for communication. You can verify that with the netstat command as shown below.
[root@linuxnix ~]# netstat -tulpn | grep node
tcp6       0      0 :::9100                 :::*                    LISTEN      3078/node_exporter
[root@linuxnix ~]#
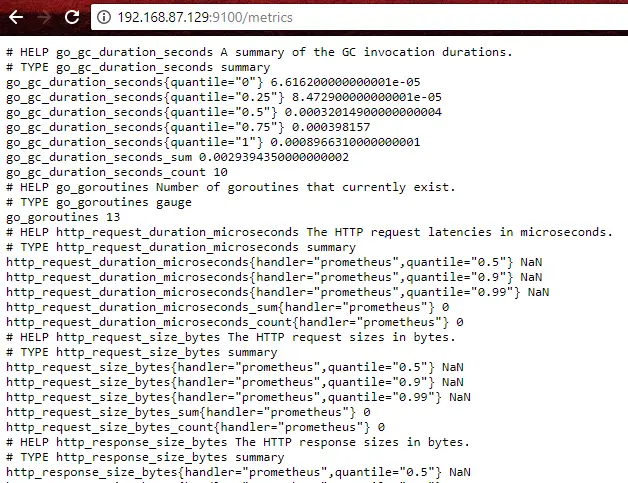
After the service has been started successfully point a web browser to the URL http://your_server_ip:9100/metrics to view the node exporters’ web interface. You should see a static web page with a lot of text on it.
Here’s a screenshot of what I saw:
Step 4: Starting the Prometheus server.
We could set up the Prometheus server also as a systemd service similar to what we did for node exporter earlier but for the sake of keeping the demonstration simple I’ll use it directly here.
Now we had to the directory where we had extracted Prometheus.
[root@linuxnix prometheus]# pwd
/root/prometheus
[root@linuxnix prometheus]# ls
console_libraries  consoles  node_exporter  prometheus  prometheus-0.15.1.linux-amd64.tar.gz  promtool
Here we’ll create quick YAML configuration file named prometheus.yml and populate it with the following content.
[root@linuxnix prometheus]# cat prometheus.yml
scrape_configs:
  - job_name: "node"
    scrape_interval: "10s"
    target_groups:
    - targets: ['localhost:9100']
For those of you unfamiliar with the YAML format I must point out that it’s extremely sensitive to line spacing so be careful.
In the prometheus.yml file we’ve created a scrape_configs section and defines a job called node. It includes the URL of your Node Exporter’s web interface in its array of targets. The scrape_interval is set to 10 seconds so that Prometheus scrapes the metrics once every fifteen seconds. You could name your job anything you want, but calling it “node” allows you to use the default console templates of Node Exporter.
Now let’s start the Prometheus server in the background and also add nohup command so it continues to run after the current session has been terminated.
[root@linuxnix prometheus]# nohup ./prometheus > prometheus_linuxnix.log 2>&1 &
[1] 4156
[root@linuxnix prometheus]#
Let’s query the log file.
[root@linuxnix prometheus]# tail prometheus_linuxnix.log
nohup: ignoring input
prometheus, version 0.15.1 (branch: master, revision: 64349aa)
  build user:       julius@julius-thinkpad
  build date:       20150727-17:56:51
  go version:       1.4.2
time="2017-11-03T11:49:40-04:00" level=info msg="Loading configuration file prometheus.yml" file=main.go line=173
time="2017-11-03T11:49:40-04:00" level=info msg="Loading series map and head chunks..." file=storage.go line=263
time="2017-11-03T11:49:40-04:00" level=info msg="0 series loaded." file=storage.go line=268
time="2017-11-03T11:49:40-04:00" level=info msg="Starting target manager..." file=targetmanager.go line=75
time="2017-11-03T11:49:40-04:00" level=info msg="Listening on :9090" file=web.go line=186
The message “Listening on :9090” implies that the Prometheus server is now up and running.
We’ll just look for the port 9090 in the netstat output just to be sure that the port is open.
[root@linuxnix prometheus]# netstat -tupln | grep 9090
tcp6       0      0 :::9090                 :::*                    LISTEN      4156/./prometheus
[root@linuxnix prometheus]#
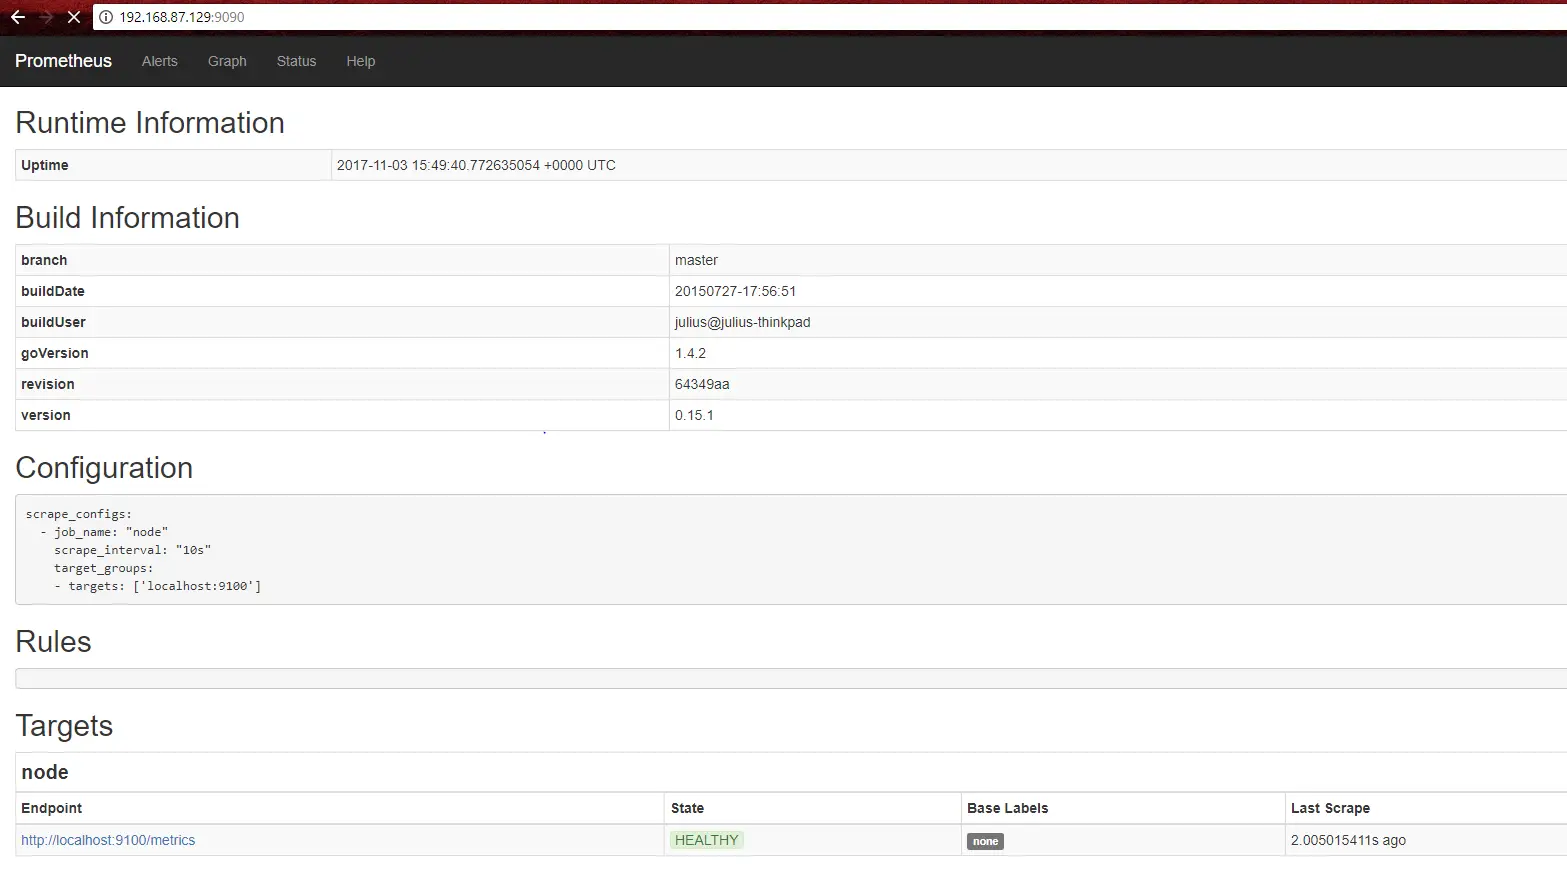
Now point your browser to the URL http://your_server_ip:9090 to open Prometheus homepage and you should be greeted with something similar to the following screenshot:
Step 5: View metrics scraped by Prometheus.
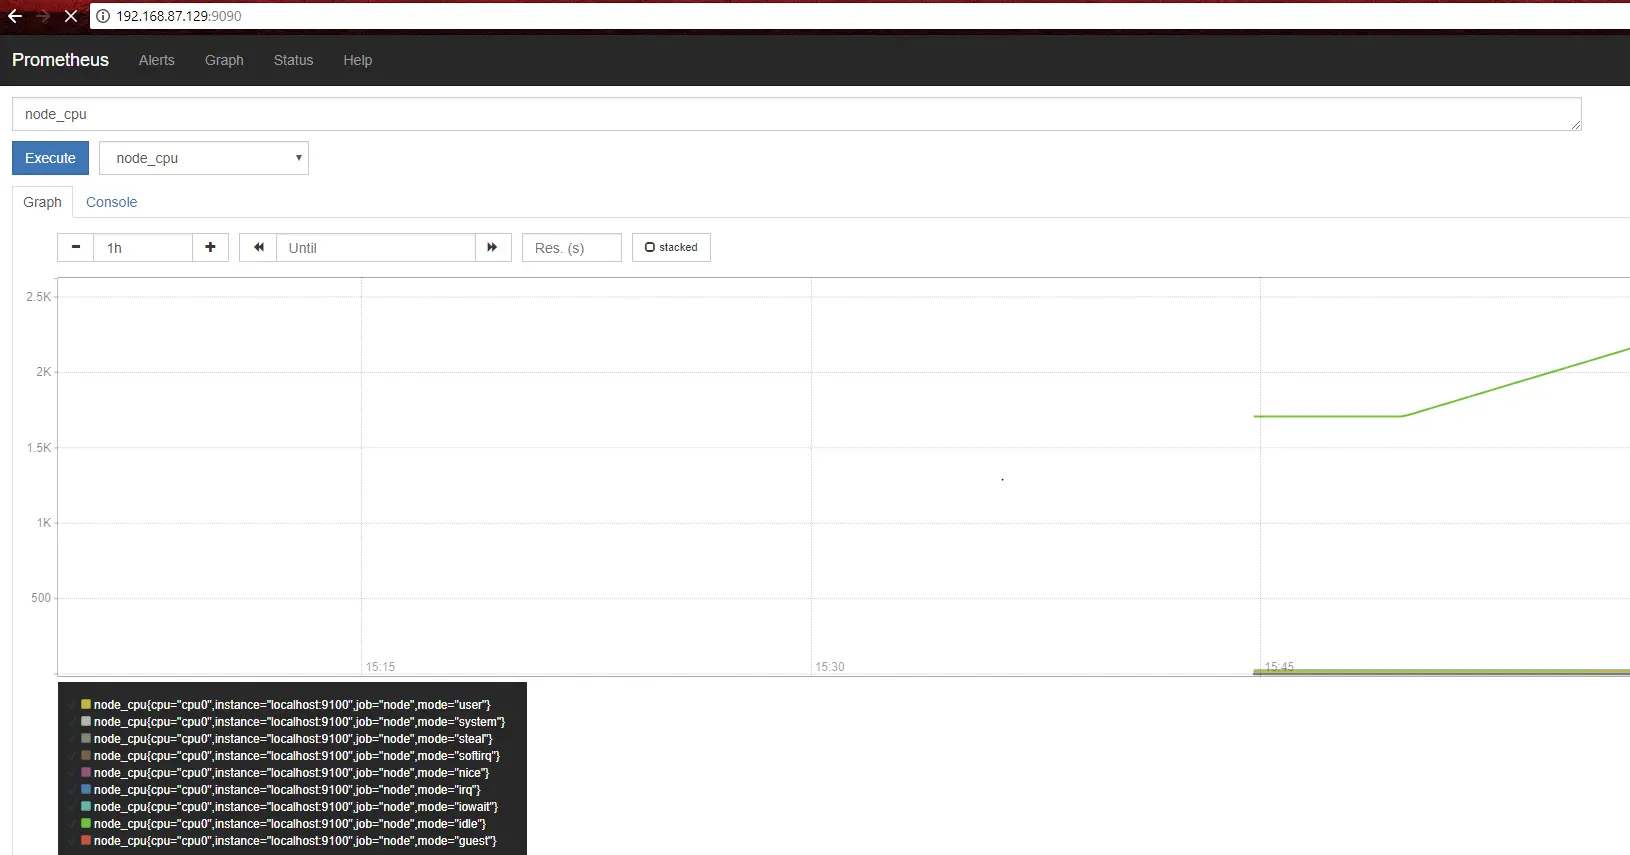
To verify that Prometheus is gathering data from the node exporter, click on the graph tab on the Prometheus homepage.
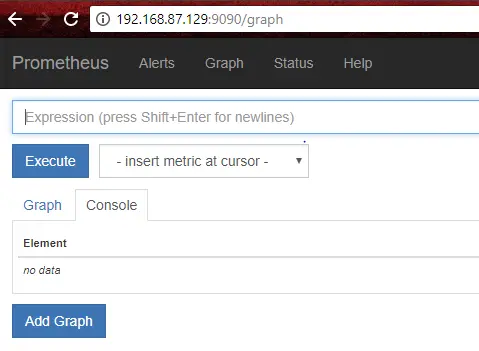
On this page, expand the ‘inset metric at cursor’ drop down to select a metric and view data pertaining to it and then click on execute.
Next click on the graph tab and you would be able to see a graph for that metric.
Prometheus has console templates that let you view graphs of a few commonly used metrics. These console templates are accessible only if you set the value of job_name to node in Prometheus’s configuration.
Visit http://your_server_ip:9090/consoles/node.html to access the Node Console.
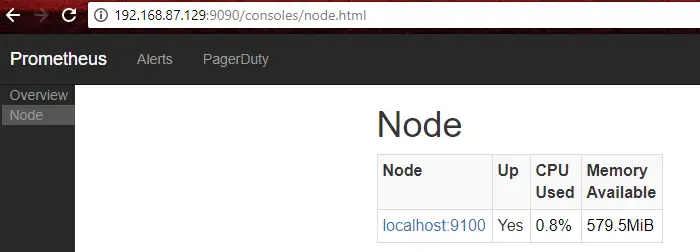
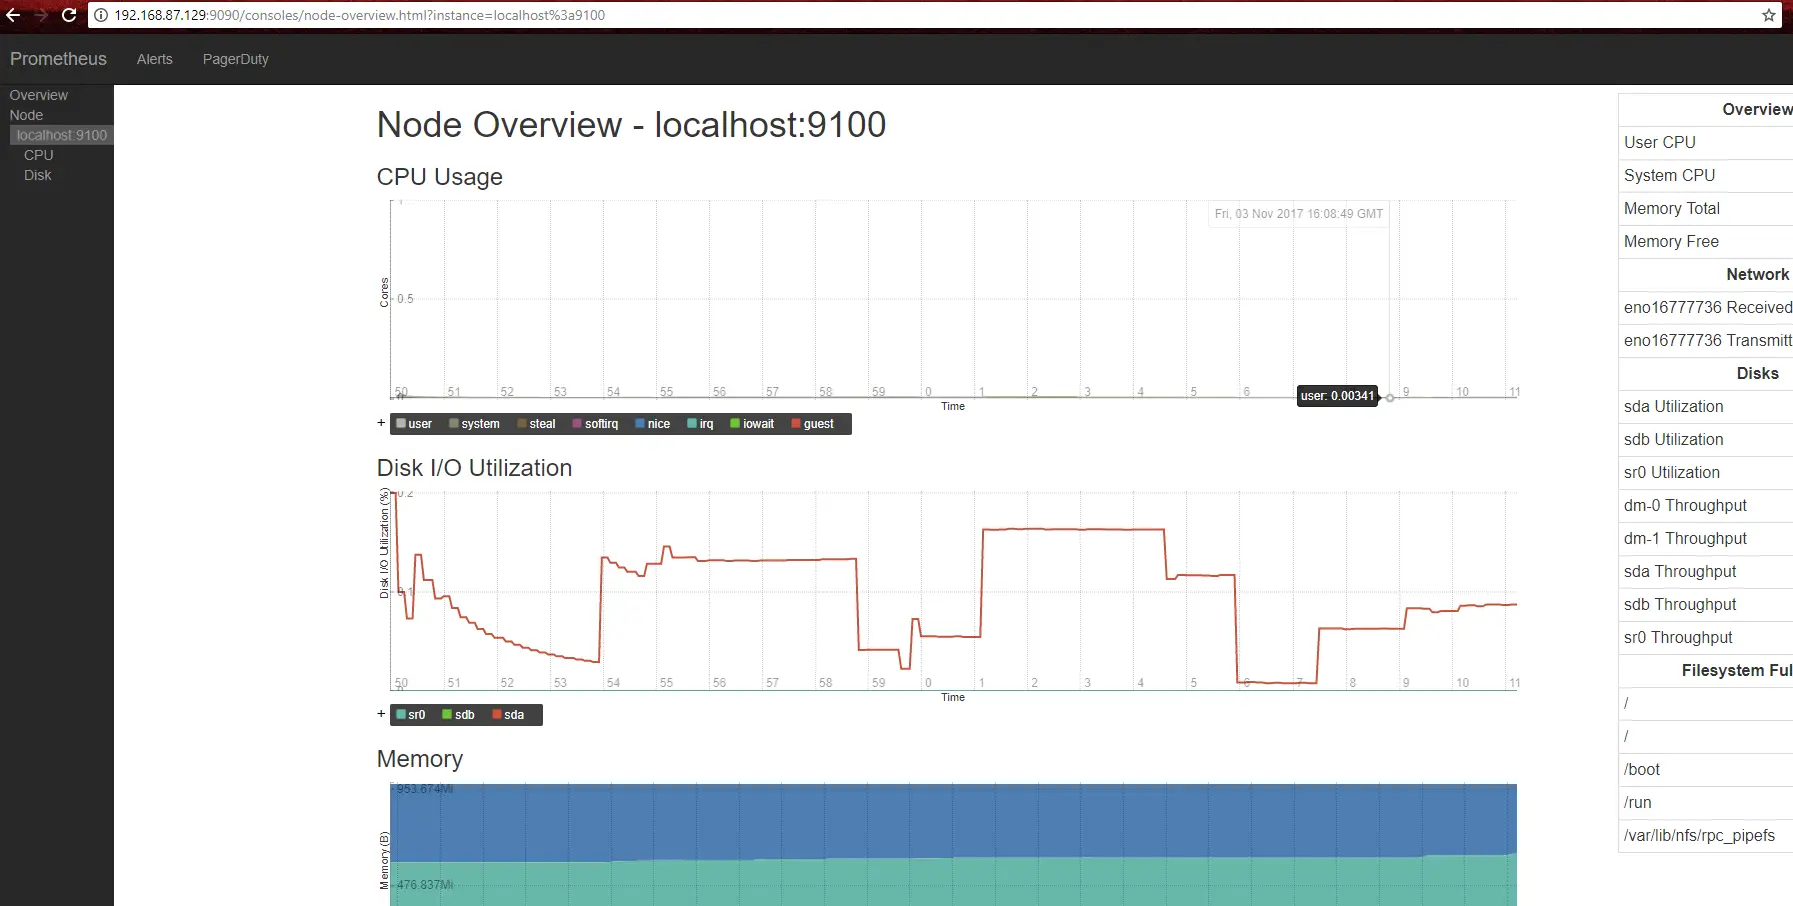
From here click on localhost:9100, to view its metrics:
Conclusion on Prometheus
This concludes our illustration of a very basic Prometheus installation and setup on a Centos 7 system. One of the interesting features we found was the fact that it’s not based on a server-client architecture making it relatively easy to maneuver as compared to conventional monitoring tools. We hope that from the demonstrations provided in this article you’ve found Prometheus to be a very user-friendly and easy to set up monitoring tool and would consider giving it a try yourself.
Sahil Suri
Latest posts by Sahil Suri (see all)
- Google Cloud basics: Activate Cloud Shell - May 19, 2021
- Create persistent swap partition on Azure Linux VM - May 18, 2021
- DNF, YUM and RPM package manager comparison - May 17, 2021
- Introduction to the aptitude package manager for Ubuntu - March 26, 2021
- zypper package management tool examples for managing packages on SUSE Linux - March 26, 2021

